Radioactive Fallout as a Marker for the Anthropocene
Nuclear markers of the Atomic Age: from the Manhattan Project to a global fingerprint
The nuclearAnthropocene arguably dawned on July 16, 1945, with the first detonation of a nuclear device in theTrinity test at Alamogordo, New Mexico, USA.1 Its roots go back, however, to the period ofrapid international development of nuclear physics at the turn of the twentieth century (following thediscovery of radioactivity by Henri Becquerel in 1896). Of course, radioactivity is a natural process on which our very existence depends, whether it be in the form of solar radiation or the internal heating of our planet. But it has only been within the last century that humans have explored radioactivity’s potential for manipulation as a tool or weapon and developed novel artificial radionuclides.
The detonation of the Trinity device on July 16, 1945 also marked a new era in the world’s geopolitics:The Atomic or Nuclear Age. Subsequentnuclear detonations, as part of theCold War arms race, globally distributed a suite ofradioactive fallout products which have been captured in the Earth’s sediments, soils, ice, and biological constructions such as corals, trees, and skeletons. This process has fingerprinted the mid-twentieth century and provides a global, almost synchronous marker in the Earth’s geological materials.2 The long half-lives of a number of these fallout products will allow their detection well into our planet’s future, and they provide a clear radiometric marker that coincides with the proposed start ofthe Great Acceleration, and the Anthropocene.
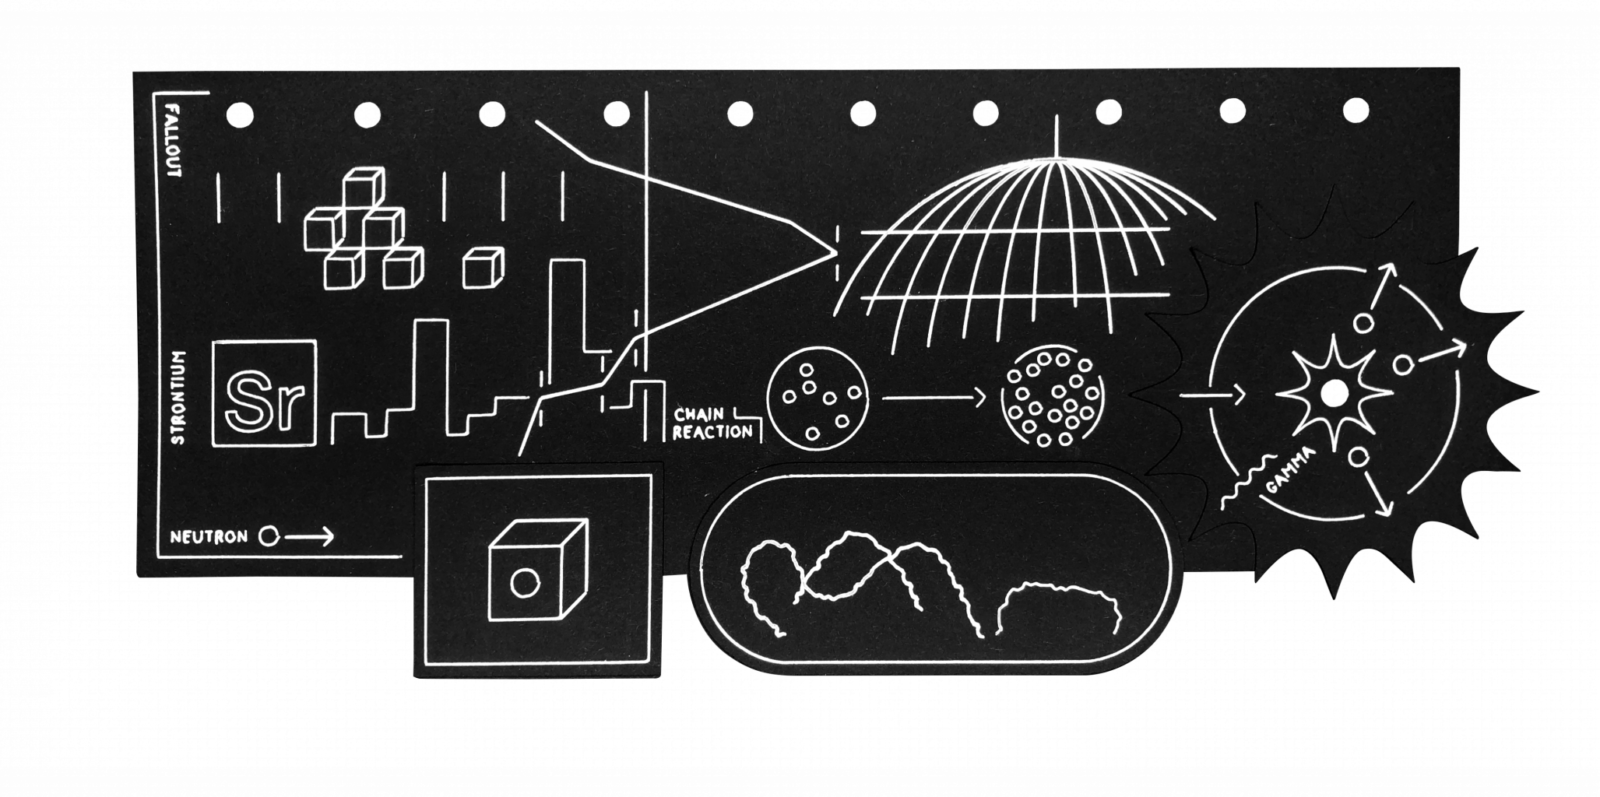
The early steps in the Atomic Age were taken in the 1930s when, following theidentification of the neutron by James Chadwick in 1932, various groups used this sub-atomic particle (effectively as a missile) to probe and bombard atomic nuclei and to create new heavier elements. Experiments and subsequent analyses in Berlin by Otto Hahn and Fritz Strassmann in 1938 showed that neutron-bombardeduranium samples contained an element (barium) with approximately half uranium’s atomic mass, one which had not been present in the original uranium sample.3 This fact was identified by Lise Meitner and Otto Frisch in 1939 as evidence for thesplitting of the uranium atom in anuclear fission process involving the uranium isotope U-235. This discovery, and the subsequent realization of the energy release that could be generated by this process (if the fission reaction also emitted enough secondary neutrons, a chain reaction could potentially occur, releasing enormous amounts of energy, Figure 1), made the development of an atomic bomb a theoretical possibility—a possibility taken to its military conclusion in the Manhattan Project.
Following the discovery ofplutonium (produced by nuclear conversion of the heavier uranium isotope U-238) at the University of California, Berkeley, in 1940, a program began to enrich and to produce in bulk two heavy radioactive isotopes capable of fission: U-235 and Pu-239, which could be used in different designs of the atomic bomb. The Trinity test in 1945 successfully detonated a plutonium-based device with an energy equivalent of 22 kilotons of TNT; the next month saw the detonation of the enriched uranium-based bomb Little Boy atHiroshima, and the plutonium-based bomb Fat Man atNagasaki.
Figure 1. The nuclear fission process. The splitting of the U-235 atom generates a burst of energy and fires out neutrons which can generate further fission events in a chain reaction. The fragments generated by the fission process form fission products, which decay to a stable isotope form by emission of beta and gamma radiation. If a neutron is absorbed (shown here with U-238) without causing a fission event, then heavier actinides, such as Pu-239, are produced. Diagram adapted by Nathaniel LaCelle-Peterson from original http://www.zamandayolculuk.com/
Later atomic detonations used more powerful (higher yield) fission-fusion or fission-fusion-fission devices—H-bombs—which used a fission explosion to produce the intense pressures and temperatures required to fuse hydrogen nuclei in afusion reaction. This fusion reaction is capable of releasing vastly more energy (and explosive power) than the equivalent fission reaction, and importantly,atmospheric detonation of these more powerful devices is capable of blasting radioactive and irradiated material high into the atmosphere, from where it can be hemispherically or globally distributed before returning to the Earth’s surface as nuclear fallout (indeed, later tests were carried out at stratospheric altitudes). With the initiation of a program ofhigh-yield thermonuclear testing, beginning with the 10.4 megaton (TNT equivalent)Ivy Mike test at Enewetak Atoll in the Pacific Ocean on November 1, 1952, nuclear fallout shifted from being a regional to effectively aglobal fingerprint of the Atomic Age (Figure 2).
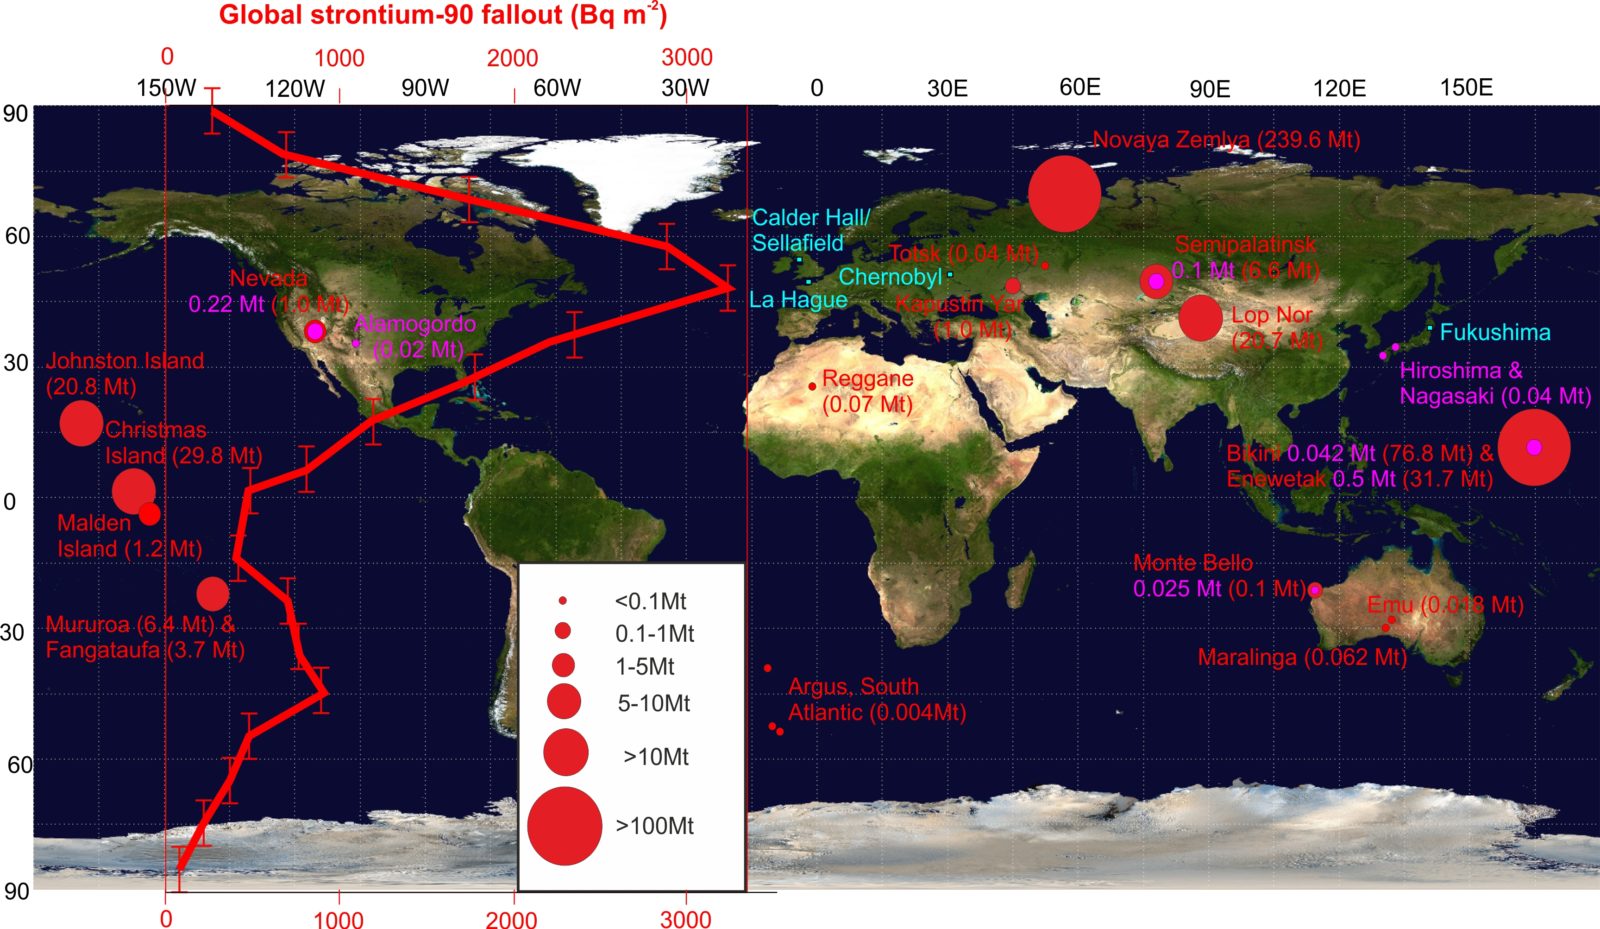
Figure 2. The locations of significant human contributions to radionuclide signals. The distribution and total fission and fusion yields, in megatons, of atmospheric nuclear weapons tests (those in purple predating the first H-bomb test on November 1, 1952 and those in red following that event) emphasizes the relatively limited scale of the first seven years of testing. The location of significant nuclear accidents/discharges are shown in blue. Superimposed is the latitudinal variation of global strontium-90 fallout, in becquerels per square meter. Note that the yield of tests and hence magnitude of the Sr-90 signal is greatest in the Northern Hemisphere—the mid-latitude Sr-90 peak is controlled by natural atmospheric circulation cells rather than the latitude of maximum detonations. A similar but much smaller peak is seen in the Southern Hemisphere. Data sourced from UNSCEAR, 2000 and modified from Waters et al. 2015. Satellite equirectangular projection courtesy NASA.
Trends in fallout over time, and the contribution from nuclear discharges and accidents
The Ivy Mike test heralded a series of subsequent high yield thermonuclear tests by the major nuclear powers in the Pacific Proving Grounds (around the Marshall Islands, including Bikini Atoll, Enewetak Atoll, Johnston Island, and Christmas Island), the Eurasian continent (particularly the Novaya Zemlya, Semipalatinsk and Lop Nor testing grounds), the South Pacific, Australia, and the South Atlantic (Figure 2). Some 543 atmospheric nuclear explosions have occurred in total.4 The period following the Ivy Mike test through to the end of 1958 saw anupsurge in the number of tests (40 percent of the total and on average, a detonation every 10 days) and fallout of radioactive products, or radionuclides, from these tests (Figure 3).5 This was interrupted in 1959 when, following arise in public and political concern about nuclear fallout debris—particularly the common fallout product Sr-90—contaminating food sources, anuclear weapons testing moratorium was agreed upon by the major nuclear powers.
Testing resumed and quickly accelerated in 1961 with theTsar Bomba 50 Mt+ test detonation on October 30 over Novaya Zemlya—this would be the most powerful nuclear weapon ever created and tested.Tests peaked in 1962, with about a fifth of all atmospheric detonations and a third of the estimated explosive yield occurring in that year, at a rate of one every three days. The subsequent implementation of aLimited or Partial Test Ban treaty in 1963 limited test detonations of nuclear weapons to those conducted underground, and hencegreatly reduced atmospheric dispersal of radionuclides, but still allowed the potential for significant contamination of local groundwaters. This treaty was initially only a trilateral agreement between the United States, the Soviet Union, and the United Kingdom, and so further(limited) above-ground testing continued in the late 1960s through the 1970s at French and Chinese test sites.
Nuclear weapons testing released a range of radioactive fallout products into the global environment (although fallout varied latitudinally, and was heaviest in the Northern Hemisphere, Figure 2), with a clearfallout maximum in 1963, resulting from the acceleration of testing in 1962. Further fallout of the plutonium isotope Pu-238, mainly in the Southern Hemisphere, occurred following theburn-up of the nuclear-powered SNAP 9A satellite in 1964. Parallel to the weapons testing program, the fission reaction was harnessed fornon-military power generation purposes, which was demonstrated initially in the UK with theopening of the Calder Hall nuclear power reactor (part of the Sellafield nuclear complex) in 1956. Nuclear power generation capability was subsequently developed in over 30 nations.Accidents at nuclear power facilities (particularlyChernobyl in 1986 andFukushima-Daiichi in 2011) andlicensed discharges from nuclear fuel reprocessing complexes (notably Sellafield, UK and La Hague, France, Figure 2) have also input significant amounts of fission and other products to terrestrial and marine environments, as well as into the atmosphere. Total inputs from each of these sources have typically been less than one percent of that from atmospheric weapons testing. While they provide aregionally significant input which has labelled soils, sediments, and other environmental materials with their discharge or release products, over-printing the global fallout signature, these products do not form a global marker. Geologically speaking, they are also diachronous: their input “pulses” to the environment span a period of over 50 years from the Great Acceleration into the twenty-first century. However, these releases can provide useful local chronological markers relating to specific emission events.
Figure 3. Timeline of key events that have influenced anthropogenic radiogenic signatures. The frequency of atmospheric and underground nuclear weapons testing is compared with the fallout signals detected for plutonium and radiocarbon (C-14). Note that fallout follows the aggregate number of tests, with a time lag of 6 months–2 years, with the C-14 peak lagging and at reduced levels in the Southern Hemisphere compared with the Northern Hemisphere. Data on aggregate test numbers sourced from UNSCEAR (2000) (footnote 4), atmospheric C-14 concentrations from Hua et al. 2013 and for Pu from Hancock et al. 2014 (footnote 5). Redesigned from Waters et al. 2015 (footnote 1) by Luis Melendrez Zehfuss
Key fallout products, their half-lives, and environmental behavior: Forming a stratigraphic signature
The specific fallout products released following a nuclear detonation depend on the characteristics of the device detonated and the nature of the detonation. Generally, these products can be organized by the following three categories, based on their mode of generation:
Fission products: A wide range of radionuclides produced by the fission of uranium or plutonium, fission products effectively form two fragments of the fissioned or split nucleus, most commonly with atomic masses of 90–100 and 130–140. Fission products range in half-life (specifically, the time taken for half of the original radioactive atoms present to decay) from fractions of a second to thousands of years. They typically decay to a stable isotope form by emission of beta particles (electrons ejected from a radioactive nucleus following the splitting of a neutron into a proton and electron, Figure 1) and gamma-ray photons (packets of energy emitted by the nucleus). Common fission products include isotopes of iodine, caesium, strontium, xenon, and barium.
Actinides: “Transuranic” (heavier than uranium) nuclei or actinides are produced by the capture of neutrons by U-238 and other heavy isotopes which do not lead to nuclear fission. Plutonium is by far the most commonly produced actinide (an estimated 3.5 metric tons of Pu is present in the global environment due to weapons testing), with Pu-239 (24,000 year half-life) being the most abundant isotope. Nuclear detonations (and nuclear reactors) generate other actinides in smaller quantities, e.g., neptunium-238, americium-241 and -243, and curium-244 and -245. While actinides are produced in smaller quantities than fission products they typically have much longer half-lives, and can also emit alpha particles (heavy, positively charged particles ejected from the nucleus), which, if absorbed into the body, are significantly more dangerous than the beta and gamma radiation emitted by fission products.
Activation products: Resulting from neutron bombardment during nuclear detonations or reactor operation, and thus strictly speaking including actinides, activation products typically refer to the products of neutron capture by other materials, such as containment structures or external environmental materials. The specific radionuclides that result from the activation process depend on the materials used in the reactor or bomb, and (for nuclear detonations) the surface over which the test was conducted and its altitude. Common activation products are tritium (H-3), radiocarbon (C-14, Figure 3, from neutron interactions with atmospheric nitrogen), Cl-36 (from activation of Chlorine in seawater in the early thermonuclear tests), and isotopes of Mn, Co, Fe and Zn (from the vaporization of metal casings).
The post-fallout behavior of these radionuclides depends on their chemistry and the characteristics of the environment into which they are deposited. H-3, for example, is a readily soluble radionuclide which can be used as an environmental tracer of seawater circulation, groundwater movement, and pollution, while other products (Pu, Am isotopes) show stronger interaction with biological tissues or sedimentary particles. The more particle-reactive radionuclides show strong interaction with the sedimentary and biological materials that make up the Earth’s stratigraphic record. For example, the“bomb peak” in C-14 in 1963–1964 (Figure 3) can be detected in most carbon reservoirs, including peat deposits, soil, wood, coral, and bone. Pu isotopes readily associate with clays and organic particles in lake, marine, and other settings, allowing characterization of distinct fallout signatures in marine and lake sediments, ice cores, and other media. While plutonium is typically immobile once deposited it can, however, migrate in acidic peat profiles, adding anthropogenic plutonium to layers that were deposited before the period of nuclear weapons testing. Similarly, the C-14 present in deep marine sediments, which represent some of the key materials preserved in the geological record, records a mixed signal of atmospheric and ocean carbon pools. The delay in isotopes settling through the water column can cause significant lags in peak signals, suggesting that analysis of shallow marine sediments or corals is preferable over deep marine sediments. In addition, globally, not all sites are equally exposed to historical fallout—deposition of fallout products was highest in the mid-latitudes (particularly the Northern Hemisphere mid-latitudes, Figure 2), meaning that more pronounced signals are preserved at sites in these regions.
Radionuclides as markers of the Great Acceleration and the Anthropocene
Atmospheric nuclear weapons testing, orwartime usage in the case of the Hiroshima and Nagasaki bombings, resulted in regional to global distribution of radioactive fallout. Most anthropogenic radionuclides in the environment today, locked in soils and sediments or distributed through the world’s oceans, originated from the 35-year period of atmospheric nuclear weapons testing beginning in 1945. This fallout started abruptly—with, geologically-speaking, a virtually instantaneous global release from the early 1950s (following testing of the first thermonuclear device or H-bomb)—and shows distinct, globally recognizable phases, such as the 1959 weapons testing moratorium, a fallout “pulse” in 1963 (resulting from an acceleration of testing in 1962), and a rapid decline following the Partial Nuclear Test Ban Treaty of 1963 (Figure 3). As we note above, the fallout signature is locally augmented by accidental discharges from power stations, reprocessing plants, and satellite burn-up on atmospheric re-entry, which can be tied to datable events. The less mobile and longer lived (longer half-life) isotopes produced during the period of atmospheric nuclear weapons testing, including Am-241, I-129, C-14, and various Pu isotopes, provide a long-term marker of this global fallout which has been incorporated or locked into geological materials such as ocean and lake sediments, corals, or ice. Their initial widespread release occurred at the same time as the so-called Great Acceleration: the dramatic change in magnitude and rate of the human imprint on the Earth system from about 1950 onwards. Apart from C-14, these radionuclides are rare in nature, and even C-14 (which is produced naturally by cosmic ray bombardment in the upper atmosphere) shows adoubling in input related to the period of peak nuclear weapons testing activity in the early 1960s.6 As such, radionuclides are strong candidates to define an Anthropocene basal boundary: they are mostly absent in nature; they have long half-lives that provide a long-lasting signature; they are less mobile and form a relatively fixed marker in geological deposits; they are present in sufficient quantity to be easily detectable.
By closely examining the various isotopes of Pu, which are produced in different ratios in fallout depending on the design of the weapon and the parameters of the test, it is possible to distinguish the source of the Pu,7 potentially to the level of an individual nuclear test,8 and differentiate fallout from other sources such as reprocessing facilities and nuclear reactor accidents (Figure 4).9 These fallout products, and Pu in particular, provide an extremely distinctive radiogenic signature which has been captured in the layers of the planet’s marine and lake sediments, rock, and glacial ice, and can serve as a clear, easily detected “bookmark” for the proposed start of the Anthropocene. The best sites to define this starting point, given fallout distribution by latitude, are likely located between 30 and 60 degrees north of the equator, where fallout is maximal (Figure 2), at sites within undisturbed marine or lake environments.
Figure 4. Pu isotope ratios present in a sediment core collected near Sellafield which record a shift from plutonium production for nuclear weapons manufacture (lower part of graph) to the reprocessing of spent nuclear reactor fuel (upper part of graph). The sediment core is 65cm long, and the dates shown on the left have been determined for each sediment layer by matching the profiles of the various radionuclides present in the core with their known history of release from Sellafield. The inset table shows typical plutonium isotopic ratios of various sources in the environment. Graph from Warneke 2002 (see footnote 9) and table from Wu et al. 2011 (see footnote 7), redesigned by Luis Melendrez Zehfuss
Measuring the fingerprint
Fingerprinting a particular radionuclide typically uses one of four techniques, three focused on radioactivity, and one on mass. The radioactivity (in becquerels (Bq), or atomic disintegrations per second) of a sample can be measured using a range of methods, depending on the type of particle or energy emitted by the radionuclide.
Alpha spectrometry uses passive semiconductor detectors to count (and determine the energies of) alpha particles emitted from radionuclides which have been extracted from environmental samples and plated onto a metal disk, which is held under a high vacuum. In effect, the detector records the energy pulse deposited as an alpha particle collides with it, and converts the pulse amplitude into an energy. Alpha particles are emitted with characteristic energies, and this allows the different isotopes present to be differentiated and quantified.
Liquid scintillation counting is a common method for the measurement of beta-emitting radionuclides and some alpha-emitters. It involves dissolving or suspending the active sample in a liquid scintillator (typically a “cocktail” of solvent, surfactant and “fluors” or scintillators), and counting the resultant photon emissions caused by the interaction of the beta or alpha emissions with the cocktail.
Gamma spectrometry involves the use of an energy-sensitive radiation detector (commonly sodium iodide (NaI) scintillation counters or high-purity germanium detectors) to detect gamma-ray photons and produce a gamma-ray energy spectrum that can resolve the characteristic gamma energies of different radionuclides.
Mass spectrometry, in contrast, measures the very small masses of radionuclide present in a sample rather than activity. Despite the large amounts of fallout initially released, for many fallout products the actual present mass is very small—for example, the estimated global release of Sr-90 from atmospheric weapons testing was approximately 600 PBq (6 x 10¹⁷ Bq), which equates to a total mass of just over 100 kg. Mass spectrometric methods are generally applied for highly precise measurements on longer-lived radionuclides. Recent instrumental advances mean that medium-lived fission products such as Cs-137 (in addition to longer lived actinides such as various isotopes of U and Pu) can now be measured using research laboratory-based mass spectrometers, while more expensive accelerator mass spectrometers (AMS) are used for applications such as very low-level C-14 measurement (10-12 to 10-15 14C/12C for radiocarbon dating) and trace actinide analysis (at sub-femtogram (10-15 gram) per gram concentrations). The sensitivity of the AMS technique can be illustrated by recent work on Pu-244, proposed as an indicator of past supernova events that may have triggered epoch-ending mass extinction events in deep geological time (such as at the end of the Devonian period), which use extended AMS counting to determine input rates of 15 atoms per cm2 per million years in deep sea Fe/Mn ocean crust.10
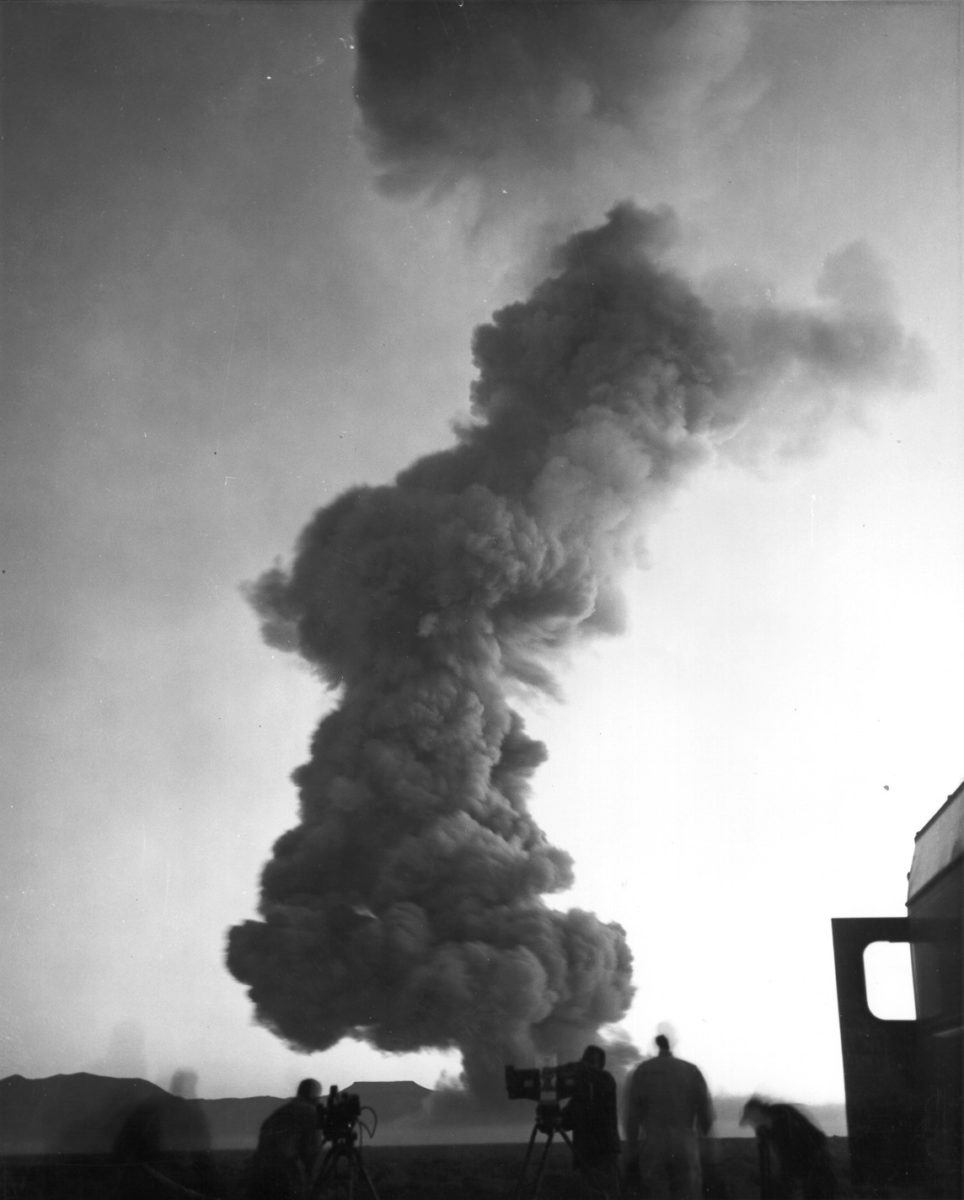
NATO observers attending an above-ground nuclear test in the Nevada desert, May 28, 1957. Photo courtesy National Nuclear Security Administration / Nevada Site Office via wikimedia, public domain
It is these techniques, in combination, that we are using to assess the nuclear fallout fingerprint in the various geological archives of our candidate Global Boundary Stratotype Section and Point (GSSP) sites for the Anthropocene. For example, at our Baltic Sea candidate site, sediments are extracted using sediment coring from ships, and the sediment cores are then split into fine depth intervals. Sediments from each of these depth intervals are sent to various laboratories for measurement of key potential Anthropocene markers—including radioactive fallout products. How we measure the different fallout products depends mainly on the decay mode of the radionuclide of interest, any measurement interferences, and its half-life. Taking plutonium as an example, sediments are dried, and the Pu is extracted using strong acids. From this point, the extract is split, with a fraction going on to alpha spectrometric analysis for the alpha-particle emitting Pu-238, another (for the beta-emitter Pu-241) for liquid scintillation counting, and a third to high resolution mass spectrometric analysis, which determines Pu-239 and Pu-240 and their ratio. This provides the fingerprint that can discriminate the early nuclear tests from later inputs such as fallout from the Chernobyl accident, and helps to determine the basal Anthropocene point in the sediment archive. Radiocarbon analysis involves selection of carbon, which registered the atmospheric C-14 signal at the time of deposition. In an ideal case, terrestrial plant remains are chosen.11 For the Baltic Sea sediments, total organic carbon is used, and the subsequent AMS analysis12 requires 0.5–1 mg of carbon. The results derived are expressed as F14C or “Fraction Modern,”13 the measured C-14 content normalized to the pre-bomb values. Values of F14C greater than 1 can be expected to follow the Pu peak.
The use of the signature or fingerprint of weapons of mass destruction to mark the beginning of the Anthropocene may be considered by some to be morally controversial or undesirable, but such a designation would be valid in stratigraphic terms and should not be regarded as commemorating or celebrating the use of atomic weapons. Instead, the radioactive fallout fingerprint could even be considered an appropriate marker, given that it marks the point at which humans not only began to steer the functioning of the Earth system itself, but also realized the capability to destroy our own civilization on a global scale.
Andy B. Cundy is Professor of Environmental Radioactivity, and Research Director of the University consultancy and research unit GAU-Radioanalytical, in the School of Ocean and Earth Science at the University of Southampton.
Colin Waters is Chair of the Anthropocene Working Group of the Subcommission on Quaternary Stratigraphy. He is honorary Professor at the School of Geography, Geology and the Environment, University of Leicester.
Irka Hajdas
is a geochronologist using radiocarbon dating as a chronometer applied in climate research, environmental studies, archaeology, cultural heritage, and forensics.
Yoshiki Saito is a coastal sedimentologist and Quaternary geologist, and the Director of the Estuary Research Center of Shimane University, Japan.
Cover art by Protey Temen, © all rights reserved Protey Temen
Please cite as: Cundy, A, C Waters, I Hajdas, Y Saito (2022) Radioactive Fallout as a Marker for the Anthropocene In: Rosol C and Rispoli G (eds) Anthropogenic Markers: Stratigraphy and Context, Anthropocene Curriculum. Berlin: Max Planck Institute for the History of Science. DOI: 10.58049/hwgt-9a13