The Anthropogenic Influence on Air Quality along the Mississippi River: Findings
In this report, Frank Drewnick, Fiona Sprang, and Lasse Moormann present the results of their project considering anthropogenic impact upon air quality along the Mississippi River, which sought to investigate how pollution concentration has varied in recent decades and to what degree these shifts can be attributed to human activity.
Figure 1: US EPA air quality network stations along the Mississippi River. Stations within a distance up to 200 km from the river are shown as red dots. The boxes represent the various area categories used within this study.
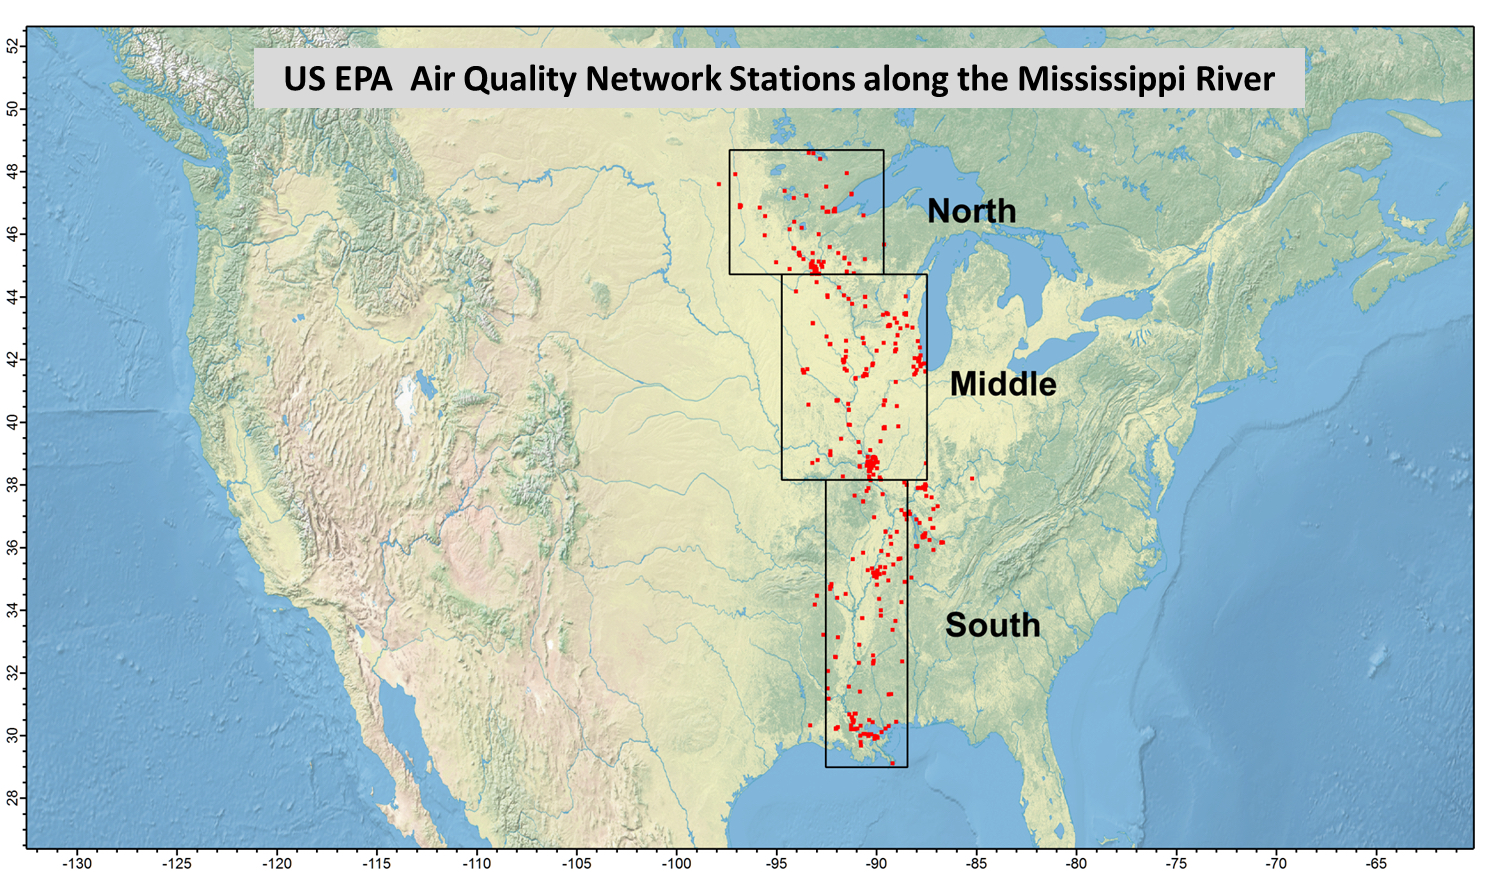
The Mississippi River passes through the center of the United States, crossing a large fraction of the North American continent from north to south. Along the river, a multitude of human influences impacts ambient air quality, ranging from agricultural activities, emissions from residential areas and traffic, all the way up to heavy industrial emissions. In addition to man-made local and regional emissions, the transport of airborne substances as well as atmospheric processes influence the ambient concentration of air pollutants in different ways. This results in a complex situation which changes over time not only due to improvements in emission control technology but as a consequence of shifting meteorological situations. In order to investigate the anthropogenic impact onto the air quality along the Mississippi River, we investigated air quality data of the US Environmental Protection Agency (US EPA) which were publicly available.
What is “air quality”?
The term “air quality” describes the composition of ambient air—in terms of trace gases and particles suspended in the air—with respect to their potential influence on human health. Several trace gases, such as carbon monoxide (CO), nitrogen dioxide (NO2), sulfur dioxide (SO2), or ozone (O3), can cause adverse health effects and are either directly emitted by anthropogenic activities or formed in the atmosphere by photochemical processes from anthropogenically emitted substances. Airborne particles are either directly emitted into the air (primary aerosol) or are generated in the atmosphere by chemical processes that form condensable species by oxidation of precursor gases (secondary aerosol). Both effects can be the consequence of natural processes (e.g. wind-blown mineral dust, sea salt, or secondary aerosol from biogenic emissions) or the result of anthropogenic activities (e.g. emissions from combustion engines, residential heating or cooking, industrial emissions, etc.). Aerosol particles are generally more complex than trace gases. In addition to their varying chemical composition, the size of these particles also has a strong influence on their health relevance: only particles smaller than approximately 10 µm in diameter can be inhaled, with smaller particles penetrating deeper into the respiratory system than larger ones. Therefore, for air quality purposes the mass concentrations of particles smaller than 10 µm, called PM10, and of particles smaller than 2.5 µm (PM2.5) are regulated.
To provide public health protection, including the health of “sensitive” populations such as asthmatics, children, and the elderly, national ambient air quality standards (NAAQS) were set by the EPA as defined in the Clean Air Act, which was last amended in 1990. These air quality standards define maximum levels of several trace gases (CO, NO2, O3, and SO2), of total particulate matter pollution (PM2.5 and PM10), and of particulate lead and corresponding averaging times for these limits. In order to control compliance with the NAAQS standards, the EPA operates a nationwide network of air quality measurement stations, located in urban, suburban or rural locations, which provide hourly averages of pollutant concentrations. Depending on the land use in their closer environment they are classified either as “commercial,” “industrial,” “agricultural,” “residential,” or “forest” stations.
How we determined air quality information
For the purpose of this study, openly available air quality data were downloaded from the US EPA Air Quality System Data Mart. To cover the Mississippi River area widely, a total of more than 250 air quality stations in a belt along the river with a distance of up to 200 km (Figure 1) were selected. All data for these stations on sulfur dioxide, ozone, nitrogen dioxide, carbon monoxide, and total particulate matter mass concentration dating back to the beginning of the respective measurements were downloaded and collected in a data base. This resulted in a data set encompassing more than 500 million concentration data points of 1-hour pollutant concentrations for many years, often going back to the year 1990. To reflect the differences in general land use in the northern, central, and southern part of the Mississippi River, stations were separated into three area categories (North, Middle, and South, see Figure 1). In addition, urban, semi-urban, and rural stations, as well as stations with different land use environments (industrial, residential, agricultural…), were considered separately before further analysis.
Trends of air pollutant concentrations over decades
Temporal trends of pollutant concentrations over several decades mainly reflect how technical developments and emission control measures affect ambient pollutant concentrations. However, they can also be an indicator for economic well-being or crisis. For air quality network stations that fall within many categories (i.e. combination of area category, environmental category and land use category), no complete data sets covering the last 30 years are available due to different numbers of stations in the various categories as well as different operation periods of the individual stations. Nevertheless, generally very similar temporal trends were observed for the various pollutant concentrations.
Figure 2: Temporal trends of nitrogen dioxide (NO2, upper panel) and carbon monoxide (CO, lower panel) concentrations in the three regions along the Mississippi River over the last three decades (monthly averages).
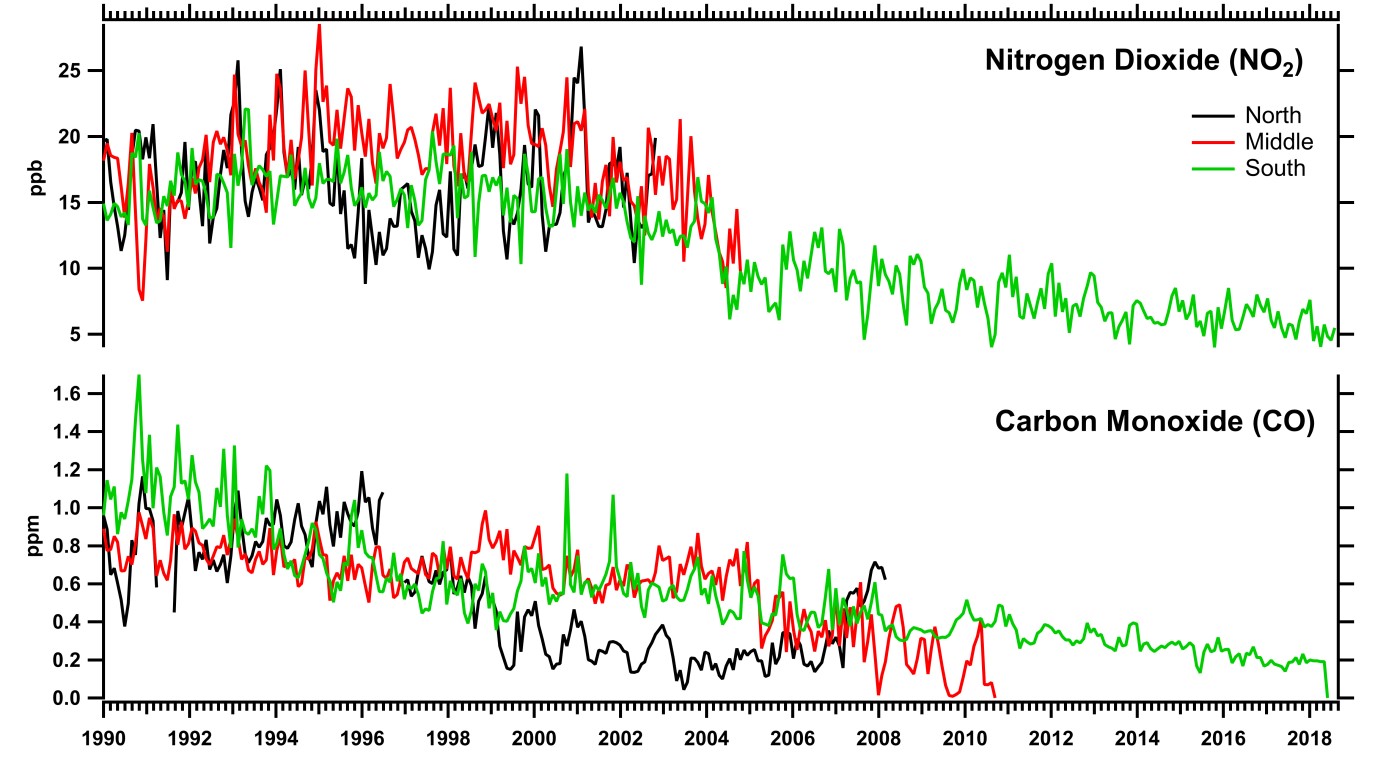
In Figure 2, exemplarily one-month averages of the nitrogen dioxide and carbon monoxide concentrations observed in suburban residential areas in all three regions along the Mississippi River were presented for the last three decades. For all regions, these pollutants show a clear decrease in ambient concentration over this time interval. This improvement in air quality is largely the result of improvements in combustion and emission control technology. Better combustion engines and appliances allow more complete combustion of carbon-containing fuels with less formation of carbon monoxide—which is a product of incomplete combustion. Better exhaust cleaning systems and optimized combustion temperatures allow a reduction of NO2 emissions.
Figure 3: Temporal trends of ozone (O3, upper panel) and particulate matter (PM10, lower panel) concentrations in the three regions along the Mississippi River over the last three decades (monthly averages).
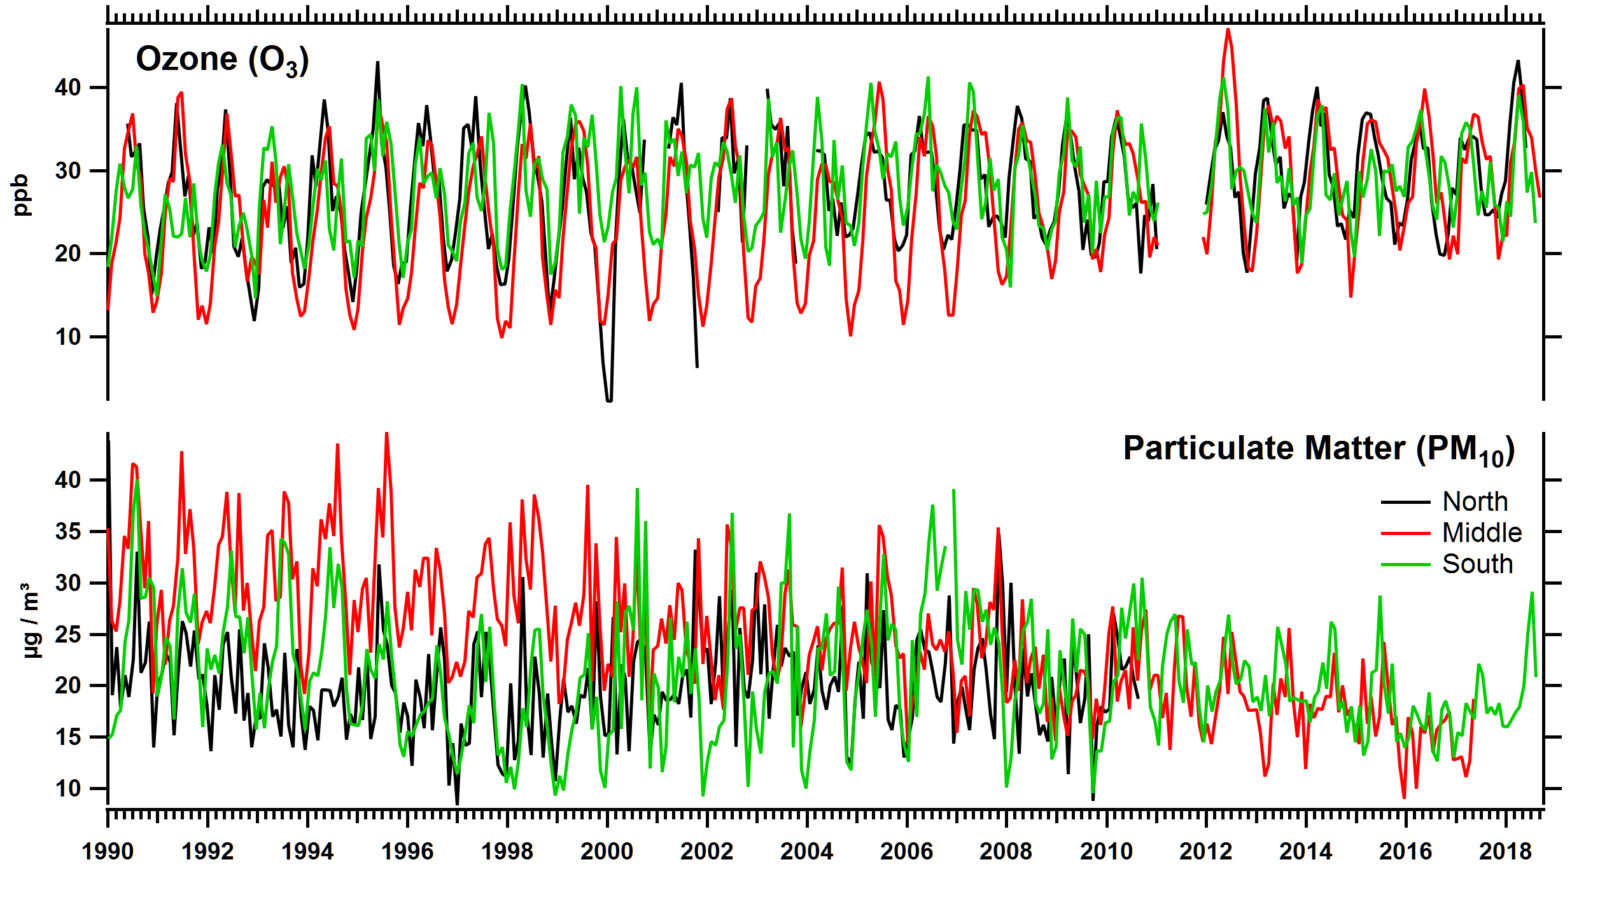
Similar improvements in ambient ozone levels or aerosol mass concentrations (PM10) have not been achieved over the last decades (Figure 3). For PM10, a slight decrease in concentration levels has been observed in the middle Mississippi area (red trace), while no clear trend can be seen for the northern and southern areas (black and green traces). Recently, the New York Times even reported that nationwide the “air quality worsens, ending years of gains.” This article was based on the observation of a 5.5 per cent increase in fine particle (PM2.5, particles with diameters up to 2.5 micrometers) concentrations over the last three years compared to the value from 2016 provided by the EPA air quality monitoring network, while the concentrations decreased during the seven years prior. A similar increase was also observed in the PM10 data in the southern Mississippi area (Figure 3, lower panel, green trace). However, when not looking only at the last seven years but at the displayed 30 years, it becomes clear that such variabilities are not uncommon for the particulate mass concentration and are not necessarily indicative of a trend. For ozone, concentration levels seem to even increase slightly over the last thirty years. Even though anthropogenic emissions have been strongly reduced over the last decades, concentrations of some pollutants do not decrease in a similar way. This behavior reflects the fact that it is not only anthropogenic emissions that affect the concentrations of these pollutants; chemical reactions within the atmosphere as well as natural sources of trace gases and particles also do so in a complex manner.
Regional differences in pollutant concentrations along the Mississippi River
To investigate differences between the three different regions along the Mississippi River, presented in Figure 1 and the different environments, i.e. urban, semi-urban, and rural areas, average pollutant concentrations were calculated for all five criteria pollutants for the last ten years using the data from the respective measurement stations. An overview of the resulting pollutant concentrations is presented in Figure 4, which shows bar graphs for each pollutant and each region along the Mississippi River, which reflect the values for all three types of environments.
Figure 4: Overview of average pollutant concentrations for the last 10 years, separated for the northern, middle, and southern region along the Mississippi River, for urban, semi-urban, and rural environments. Shown are data for ozone (O3), nitrogen dioxide (NO2), sulfur dioxide (SO2), carbon monoxide (CO), and particulate matter (PM10) concentrations.
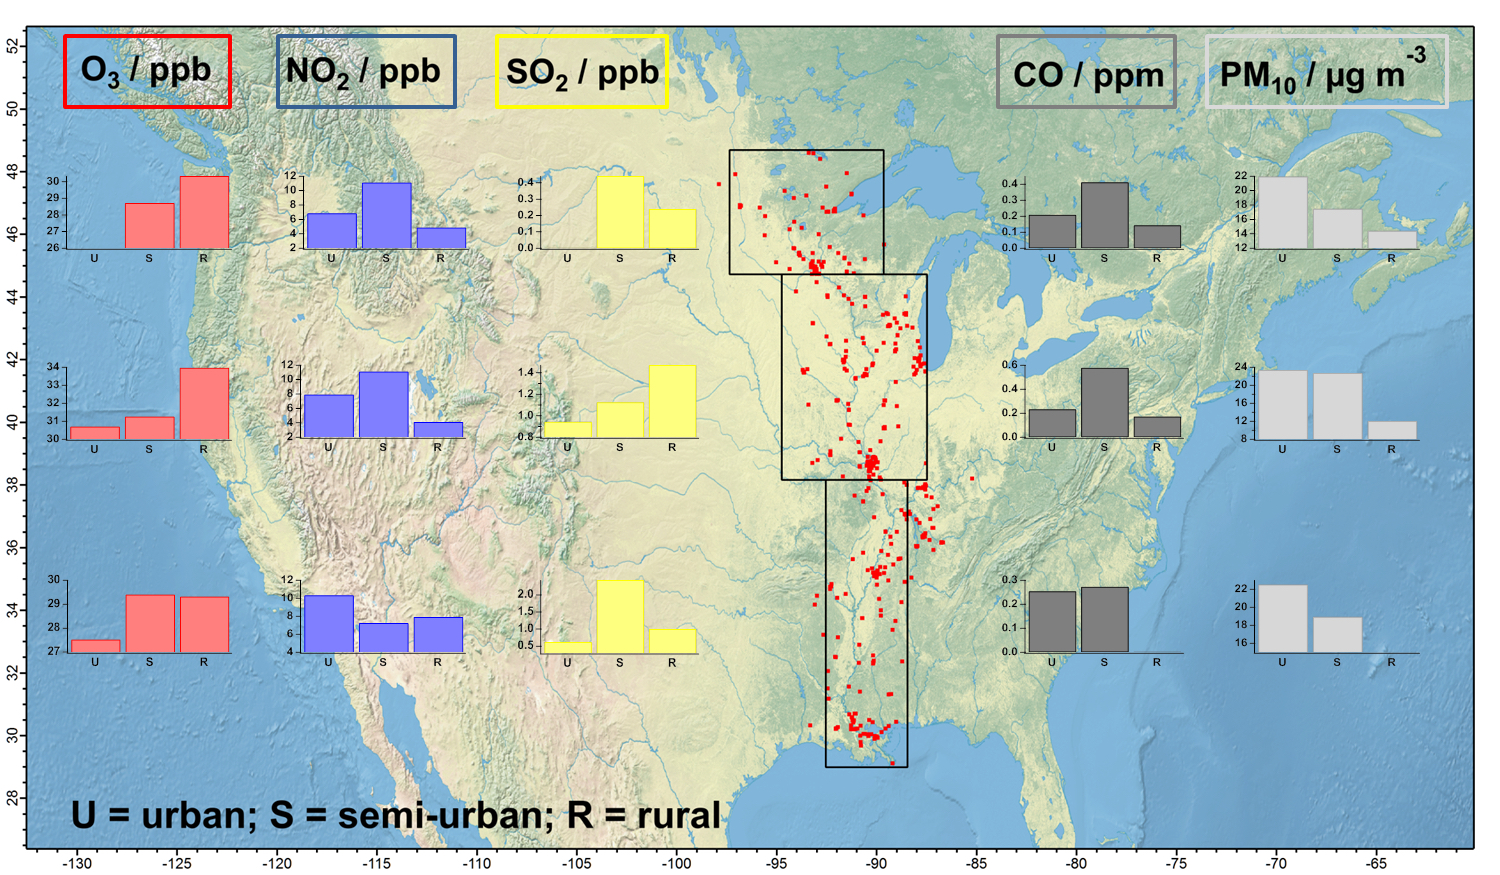
Generally, in urban and semi-urban areas pollutant concentrations for nitrogen dioxide, carbon monoxide, and particulate matter are enhanced, compared to rural areas. This is due to the fact that in urban areas the corresponding sources, like vehicles, industry, or residential emissions, are more abundant than in rural areas. Ozone is found in higher concentrations in rural areas, compared to urban and semi-urban areas. This is because ozone is depleted by chemical reactions with nitrogen oxides in urban areas and it is photochemically formed in the atmosphere downwind of the sources. These effects cause higher ozone concentrations relatively far away from the source areas and therefore a clear anthropogenic impact in regions which are otherwise relatively weakly affected by emissions from human activities. For sulfur dioxide, no clear dependence on the type of area was found. Here, likely the distance of the individual measurement sites to the main emission sources—i.e. coal-fired power plants and, in the southern region, also emissions from ocean-going ships—dominates the measured SO2 concentrations.
When comparing pollutant concentrations for the three regions along the Mississippi River, one can find a general increase in sulfur dioxide concentration from north to south. This is in good agreement with the higher density of population and industrial facilities in the middle and especially southern areas, compared to the northern area which is dominated by forests and natural parks. For ozone, no general trend along the river was found, suggesting that differences in sunlight intensity from the northern end of the Mississippi down to the southern end do not result in strongly different ozone production rates. However, for rural areas, which are less affected by local emissions, smaller ozone concentrations are found in the southern area. This is in agreement with generally higher rural nitrogen dioxide concentrations in this area, compared to those further upstream the Mississippi River. For particulate matter concentrations, no clear trend along the river is found. This likely reflects the fact that aerosol particles are not only generated by anthropogenic activities but also by natural processes.
By nature, such analyses can only reflect larger scale and averaged trends for those pollutants which are monitored in the air quality network. More in depth measurements of other toxic pollutants in individual environments can result in very different findings. For example a recently published analysis by ProPublica revealed that while general air pollution indicators have improved over the last decades, “toxic air pollution in Louisiana’s industrial belt is rising in absolute terms.” Especially in areas in close proximity to heavy polluters like chemical plants, the concentration of harmful substances in the ambient air can be strongly enhanced. Such inhomogeneity in the distribution of pollutants can be missed by the air quality network, depending on the location of the individual stations and due to the fact that not all hazardous air pollutants are monitored.
What can we learn from weekly and seasonal variabilities of pollutants?
Often, air pollutant concentrations show a regular variability with a clearly visible daily, weekly, or seasonal cycle. Such behavior is an indicator for the underlying emission or formation processes of the respective pollutant and can therefore be used to understand underlying sources. Daily patterns can reflect meteorological influences like dependence on sunlight or air temperature, but also human activities like vehicular traffic cycles or cooking activities. Similarly, yearly cycles can reflect the influence of sunlight or ambient temperature on pollutant concentrations as well as variations in human activity like heating cycles. On the other hand, weekly patterns strongly point towards human influences, since there is no reasonable meteorological effect which occurs on a seven-day cycle.
The temporal trends shown in Figure 2 and Figure 3 show clear seasonal variability for carbon monoxide (Figure 2, lower panel), and ozone (Figure 3, upper panel) concentrations and a slight seasonal variability for the nitrogen dioxide (Figure 2, upper panel) concentration. For carbon monoxide and nitrogen dioxide, the reason for this behavior is likely a seasonal cycle in the emission of these species. Both pollutants show maximum concentrations in winter, when it is probable that emissions from residential heating are strongly elevated and when, potentially, combustion engines run under less optimal temperature conditions more frequently. For ozone, the concentrations are lowest in winter because the photochemical formation of this pollutant depends on the availability of sunlight and therefore this process is less efficient during winter time.
Figure 5: Average weekly patterns for trace gas (carbon monoxide, ozone, sulfur dioxide and nitrogen dioxide) and particulate matter (PM10) concentrations, separately for all available semi-urban, urban and rural measurement stations. Data are averaged for the last 10 years.
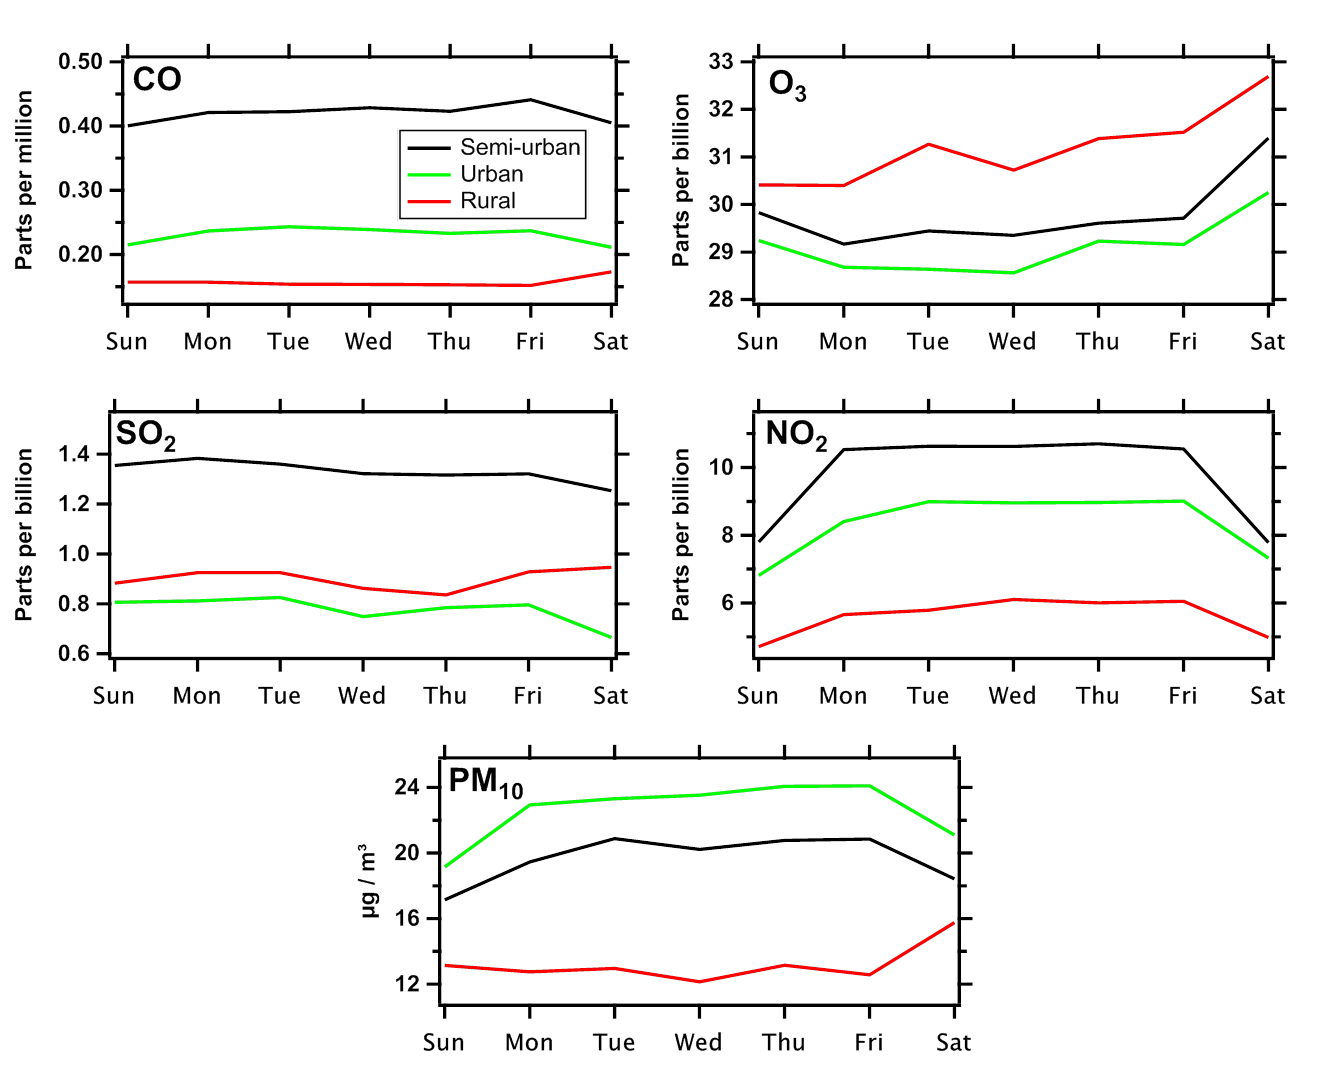
Weekly cycles are shown for the five criteria pollutants in Figure 5. For the concentration of particulate matter (PM10), different weekly patterns are observed for the different types of environment and these patterns are relatively weak. This reflects the fact that both anthropogenic and natural sources contribute to the emission and formation of particulate matter and possibly different kinds of human activities affect the concentrations at urban and rural locations. For carbon monoxide (CO) and especially nitrogen dioxide (NO2) clear weekly cycles can be seen. Since both pollutants are directly emitted from anthropogenic activities, mainly combustion processes, they are directly affected by human activity patterns and show lower concentrations during weekends, compared to weekdays. Ozone (O3), on the other hand, shows a maximum during weekends. This is not due to enhanced emission of ozone or ozone precursor materials but due to reduced destruction of ozone on weekends when nitrogen oxide emissions are lower. For sulfur dioxide (SO2) concentrations, no clear weekly cycle is found. Even though most of the SO2 emissions are caused by human activities, this is due to the fact that the majority of these emissions are from coal-fired power plants which do operate according to a weekly cycle.
Summary
To investigate the anthropogenic impact onto the air quality along the Mississippi River, openly available air quality monitoring data provided by the EPA were downloaded and investigated. More than 500 million data sets on five different criteria pollutants, measured in ca. 250 monitoring stations along the river in different environments allowed a detailed analysis of anthropogenic influences. In particular, the concentrations of directly emitted pollutants from combustion processes, like nitrogen oxides and carbon monoxide, decreased significantly over the last decades. Using weekly and seasonal variabilities, one could associate these pollutants directly with human activities like driving vehicles or heating homes. For other pollutants the situation is more complex due to multiple anthropogenic and natural generation processes (like for particulate matter) or due to complex chemical reactions in the atmosphere (like for ozone). The spatial distribution of pollutants along the Mississippi River and within different environments reflects the distribution of pollution sources with often higher concentrations in more urbanized environments. However, for ozone the strongest impact onto air quality can be observed further away from urban centers.